Functions
Introduction
Given two sets $A$ and $B$, a relation from $A$ to $B$ is a set of ordered pairs $(x, y)$, where $x \in A$ and $y \in B$. A relation from $A$ to $B$ defines a relationship between these two sets.
A function is a special type of relation in which each element of the first set is related to exactly one element of the second set. The element of the first set is called the input, and the element of the second set is called the output. Functions are used extensively in mathematics to describe relationships between sets.
For any function, when we know the input, the output is determined, so we say that the output is a function of the input. For example:
The area of a square is determined by its side length. Area (output) is a function of side length (input).
The velocity of a ball thrown in the air can be described as a function of the amount of time the ball is in the air.
The cost of mailing a package is a function of the weight of the package.
A function $f$ consists of a set of inputs, a set of outputs, and a rule for assigning each input to exactly one output. The set of inputs is called the domain of the function. The set of outputs is called the range of the function.
Consider the function $f$ where the domain is the set of all real numbers and the rule is to square the input. Then, the input $x=3$ is assigned to the output $3^2 = 9$.
Since every nonnegative real number has a real square root, every nonnegative number is in the range of this function. Negative numbers are not in the range. Hence, the range is the set of nonnegative real numbers.
For a general function $f$ with domain $D$, we often denote:
\[ x = \text{input (independent variable)}, \quad y = \text{output (dependent variable)}, \quad y = f(x) \]
For example, the squaring function can be written as $f(x) = x^2$.
Visualizing a Function

A function can be visualized as an input/output device.
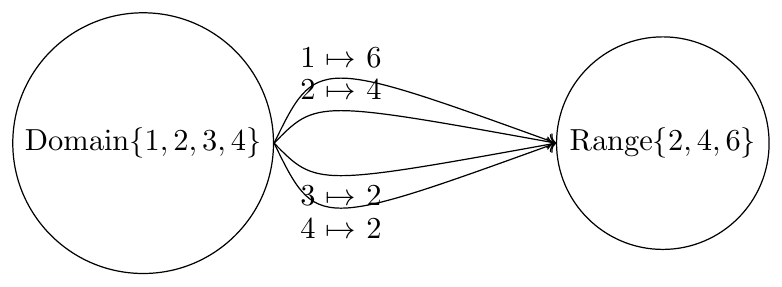
A function maps every element in the domain to exactly one element in the range. Two inputs may map to the same output.
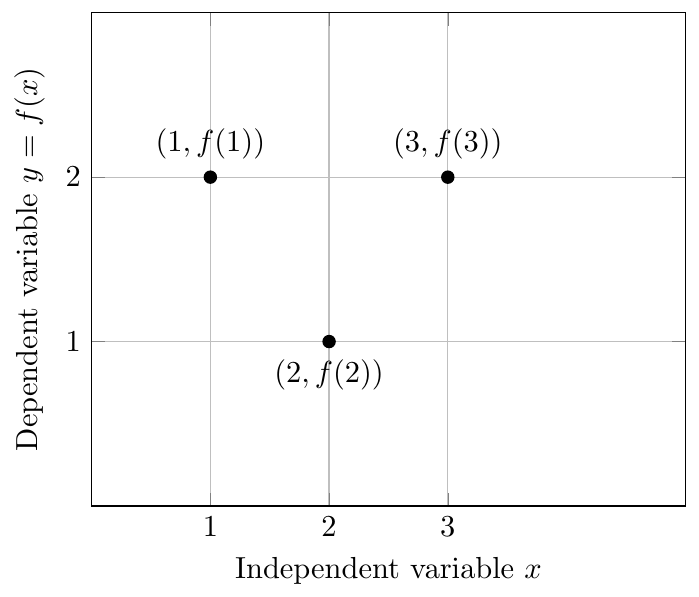
Graph of a function $f$ with domain $\{1,2,3\}$ and range $\{1,2\}$.
Graph of a Function
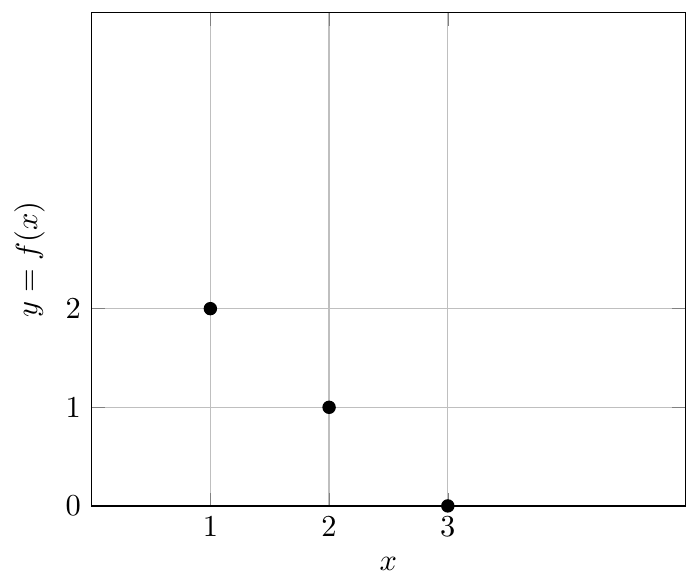
A function can also be visualized by plotting points $(x, y)$ where $y=f(x)$ in the coordinate plane.
Consider $f(x) = 3 - x$ with domain $D = \{1,2,3\}$. The graph consists of points $(x, f(x))$:
\[ (1,2), (2,1), (3,0) \]
Domain and Range
Every function has a domain. If a function is given by an equation with no specified domain, the domain is taken to be all real numbers for which $f(x)$ is real.
For $f(x)=x^2$, the domain is all real numbers.
For $f(x)=\sqrt{x}$, the domain is all nonnegative real numbers.
We can describe infinite sets using set-builder or interval notation:
\[ \{x \mid 1 < x < 5\} = (1,5) \]
\[ [1,5] = \{x \mid 1 \le x \le 5\} \]
\[ [0,\infty) = \{x \mid 0 \le x\} \]
\[ (-\infty,0] = \{x \mid x \le 0\} \]
\[ (-\infty, \infty) = \{x \mid x \text{ is any real number}\} \]
Piecewise-Defined Functions
Some functions are defined by different rules for different parts of the domain. These are called piecewise-defined functions:
\[ f(x) = \begin{cases} 3x+1, & x \ge 2 \\ x^2, & x < 2 \end{cases} \]
Evaluate $f(x)$ for $x=5$ and $x=-1$:
\[ f(5) = 3(5)+1 = 16, \quad f(-1) = (-1)^2 = 1 \]
Open and Closed Intervals
In mathematics, an interval is a set of real numbers lying between two endpoints. Intervals can be classified as:
Open interval $(a,b)$: Includes all numbers strictly between $a$ and $b$, but does not include the endpoints $a$ and $b$. Example: $(1,5) = \{ x \mid 1 < x < 5 \}$.
Closed interval $[a,b]$: Includes all numbers between $a$ and $b$, including the endpoints $a$ and $b$. Example: $[1,5] = \{ x \mid 1 \le x \le 5 \}$.
Half-open (or half-closed) intervals:
$[a,b)$ includes $a$ but not $b$.
$(a,b]$ includes $b$ but not $a$.
Classes of Functions
Functions can be categorized into several types depending on their properties and rules of assignment. Understanding these classes helps in analyzing functions effectively.
Some common classes of functions include:
1. Linear Functions
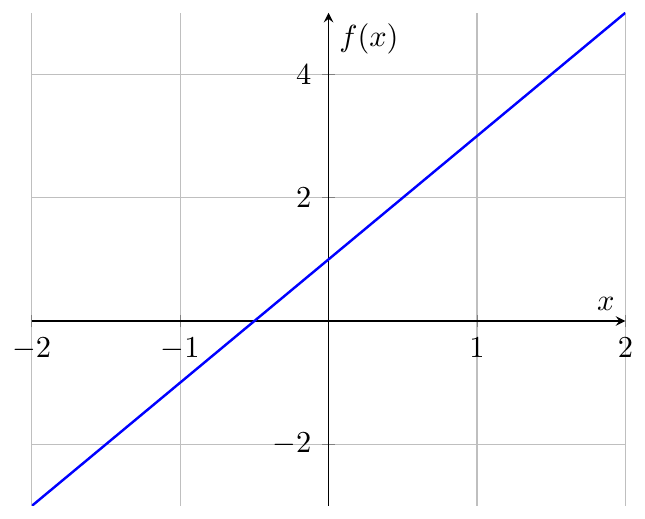
A linear function has the form: \[ f(x) = mx + b \] where $m$ and $b$ are real constants. The graph of a linear function is a straight line.
{} Consider $f(x) = 2x + 1$.
Domain: all real numbers $\mathbb{R}$ Range: all real numbers $\mathbb{R}$
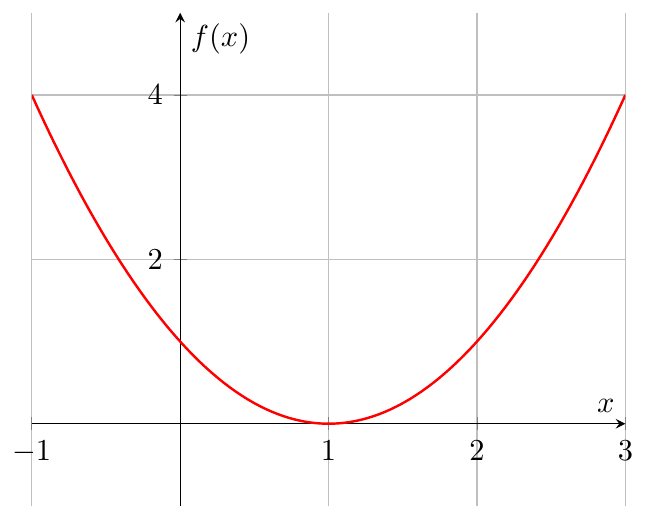
2. Quadratic Functions
A quadratic function has the form: \[ f(x) = ax^2 + bx + c, \quad a \neq 0 \] Its graph is a parabola.
{}
Consider $f(x) = x^2 - 2x + 1$.
Domain: all real numbers $\mathbb{R}$
Range: $[0, \infty)$
3. Polynomial Functions
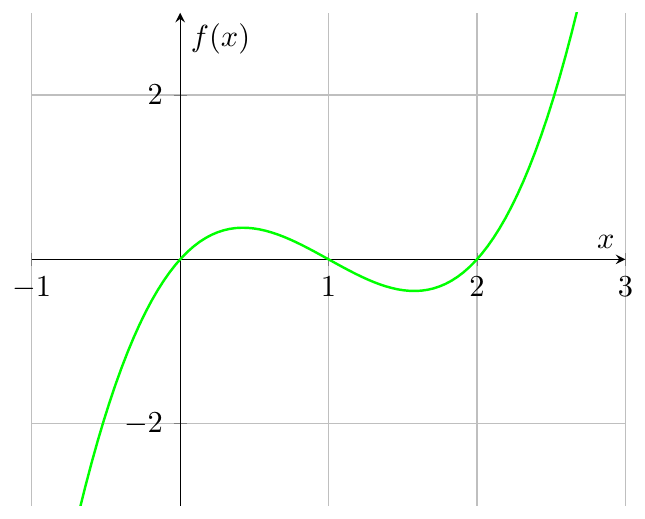
A polynomial function is of the form: \[ f(x) = a_n x^n + a_{n-1} x^{n-1} + \dots + a_1 x + a_0 \] where $a_i$ are constants and $n$ is a non-negative integer.
{} Consider $f(x) = x^3 - 3x^2 + 2x$.
Domain: all real numbers $\mathbb{R}$ Range: all real numbers $\mathbb{R}$
4. Rational Functions
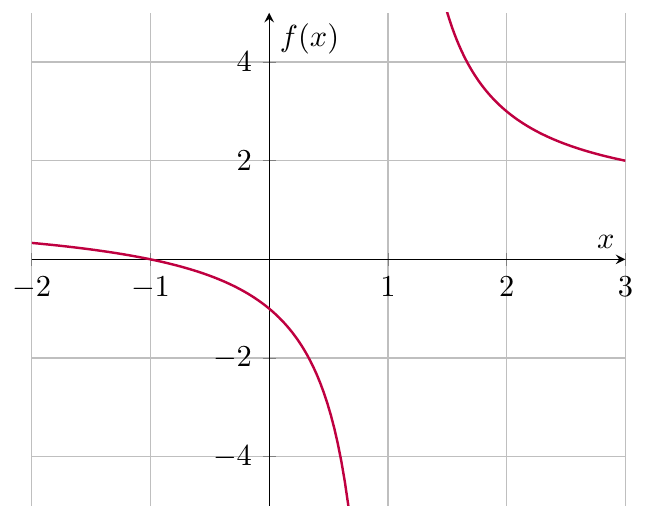
A rational function is the ratio of two polynomials: \[ f(x) = \frac{P(x)}{Q(x)}, \quad Q(x) \neq 0 \]
{} Consider $f(x) = \frac{x+1}{x-1}$.
Domain: all real numbers except $x=1$ Range: all real numbers except $y=1$
5. Exponential Functions
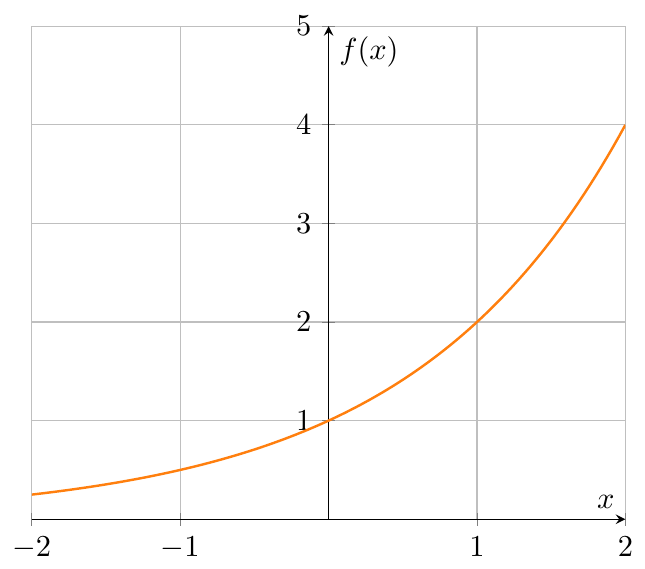
An exponential function has the form: \[ f(x) = a^x, \quad a > 0, a \neq 1 \]
{}
Consider $f(x) = 2^x$.
Domain: all real numbers $\mathbb{R}$
Range: $(0, \infty)$
6. Logarithmic Functions
A logarithmic function is the inverse of an exponential function: \[ f(x) = \log_a x, \quad a > 0, a \neq 1 \]
{}
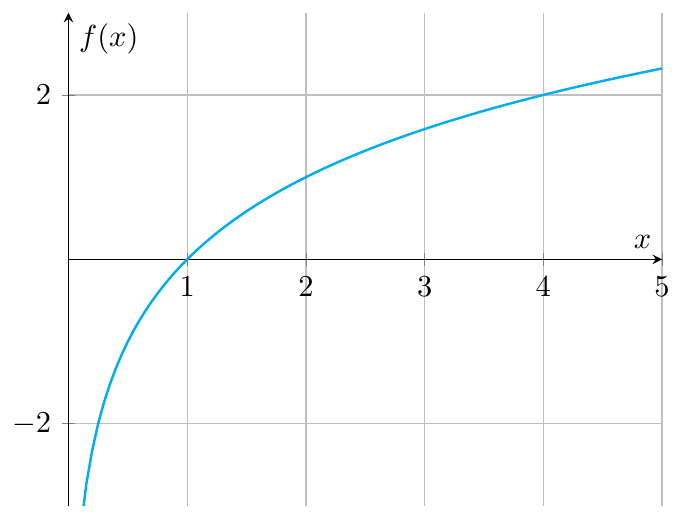
Consider $f(x) = \log_2 x$.
Domain: $(0, \infty)$
Range: all real numbers $\mathbb{R}$
7. Trigonometric Functions
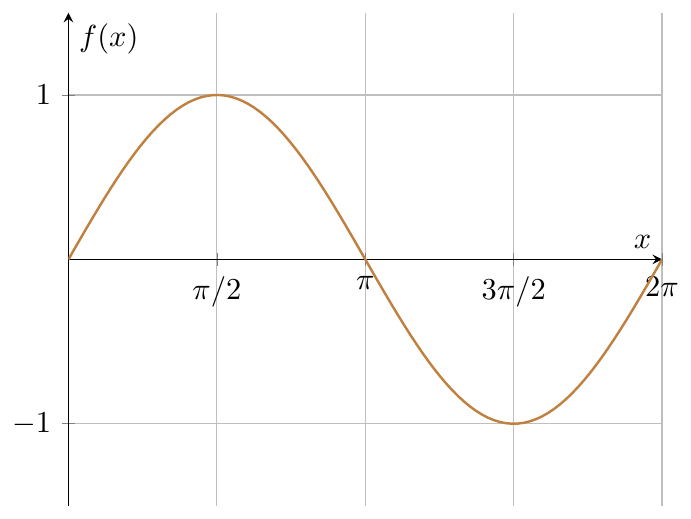
Trigonometric functions like sine, cosine, and tangent are fundamental periodic functions.
{}
Consider $f(x) = \sin x$.
Domain: all real numbers $\mathbb{R}$
Range: $[-1,1]$
8. Absolute Value Function
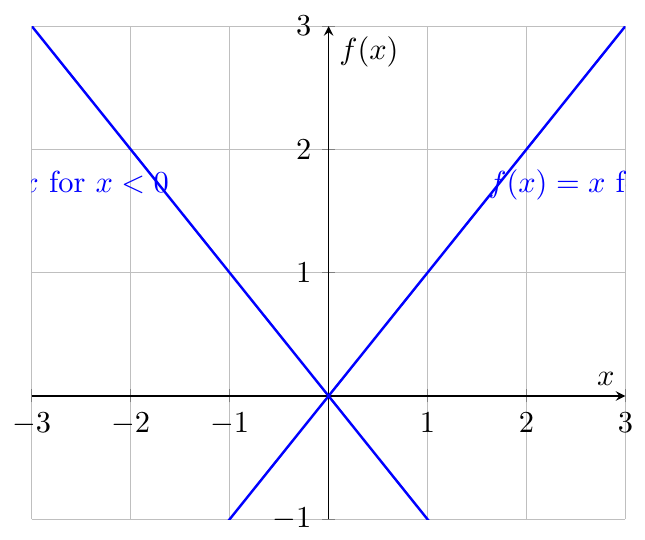
The absolute value function $f(x) = |x|$ is defined as \[ f(x) = \begin{cases} -x, & x < 0,\\ x, & x \ge 0. \end{cases} \]
The function outputs the distance of $x$ from 0 on the real number line.
For negative inputs, it returns $-x$ (makes it positive).
For zero and positive inputs, it returns $x$ (same value).
{}
Graphing $f(x) = |x|$
Properties of $|x|$
$|x| \ge 0$ for all $x \in \mathbb{R}$.
$|x| = 0$ if and only if $x = 0$.
$|ab| = |a||b|$, $|a/b| = |a|/|b|$ for $b\neq 0$.
$|a+b| \le |a| + |b|$ (Triangle Inequality).
{Evaluating $|x|$} \[ f(-5) = |-5| = 5, \quad f(3) = |3| = 3, \quad f(0) = |0| = 0 \]
Types of Functions
Functions can be classified based on how elements in the domain and range are related. Here are some important types:
One-to-One (Injective): Each element of the domain maps to a unique element of the range.
Onto (Surjective): Every element of the range has at least one element of the domain mapping to it.
Bijective: Function is both one-to-one and onto. Such functions have inverses.
Many-to-One: Two or more elements of the domain map to the same element in the range.
Constant Function: All inputs map to the same output.
Identity Function: Each element maps to itself.
1. One-to-One Function (Injective)
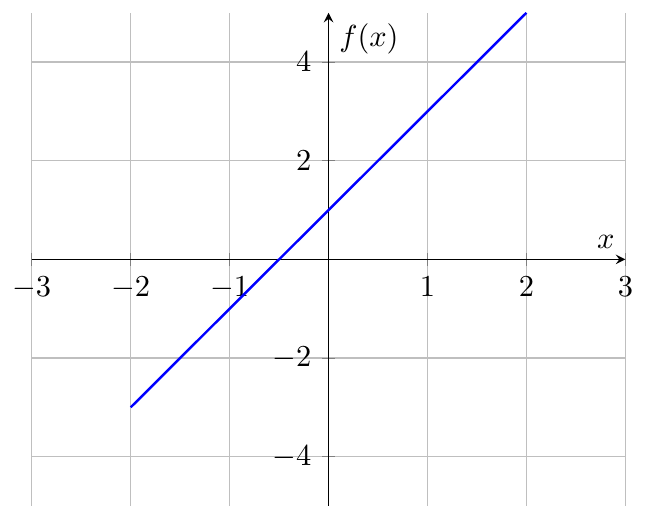
{One-to-One Function} Consider $f(x) = 2x + 1$.
Domain: $\mathbb{R}$, Range: $\mathbb{R}$
Check horizontal line test: every horizontal line intersects the graph exactly once, so $f$ is one-to-one.
2. Onto Function (Surjective)
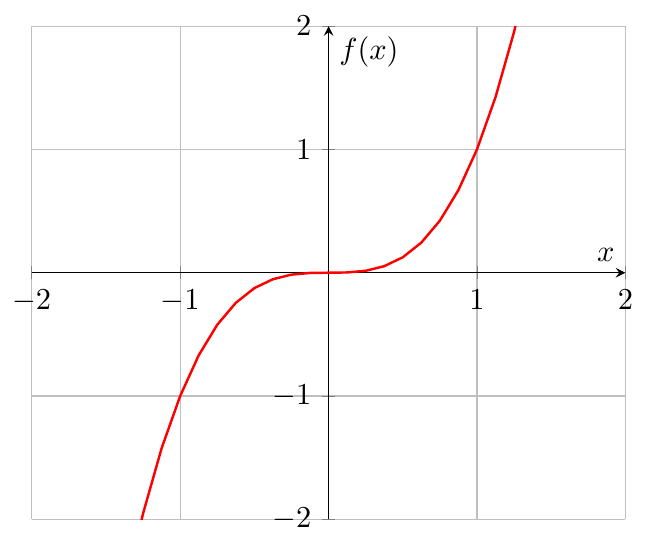
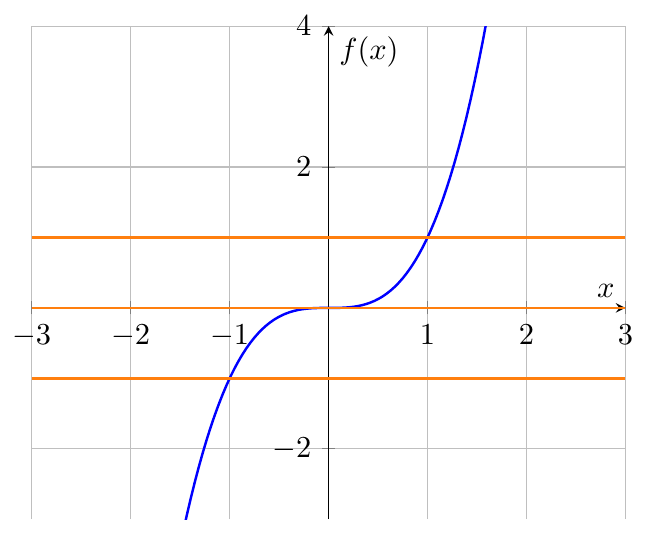
{Onto Function} Consider $f(x) = x^3$.
Domain: $\mathbb{R}$, Range: $\mathbb{R}$ Every $y \in \mathbb{R}$ has a solution $x = \sqrt[3]{y}$, so $f$ is onto.
3. Bijective Function
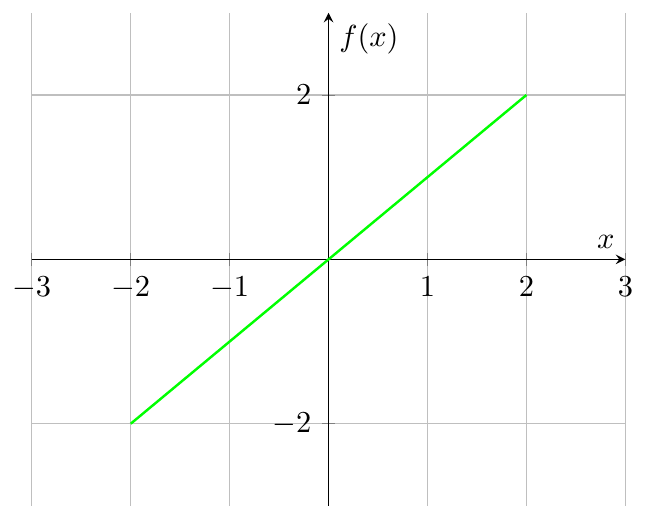
{Bijective Function} Consider $f(x) = x + 3$.
- One-to-one: Yes, each input gives unique output. - Onto: Yes, every $y \in \mathbb{R}$ is covered.
Hence, $f$ is bijective and has an inverse $f^{-1}(x) = x - 3$.
4. Many-to-One Function
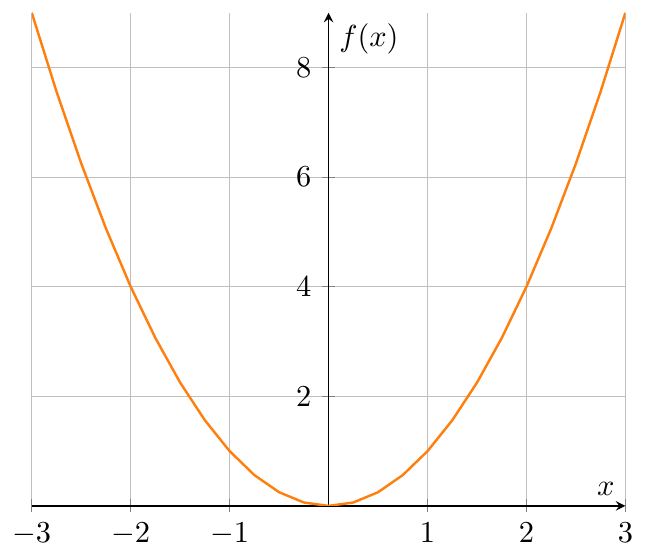
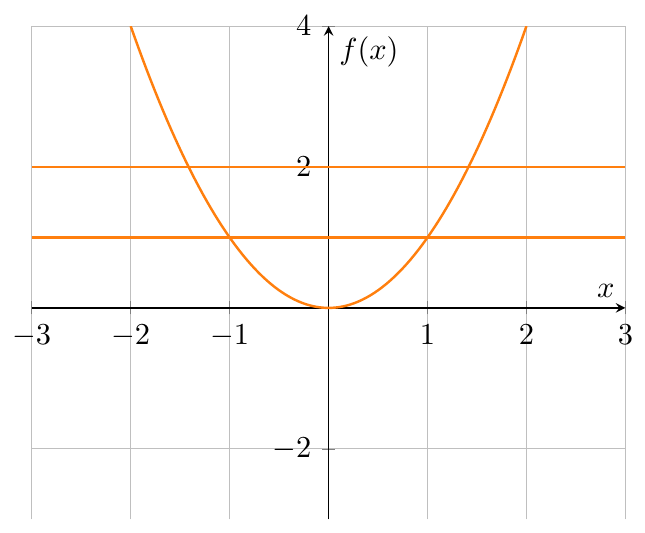
{Many-to-One Function} Consider $f(x) = x^2$.
- $f(2) = f(-2) = 4$ - Multiple inputs map to same output, so it is many-to-one. - Graph fails horizontal line test.
5. Constant Function
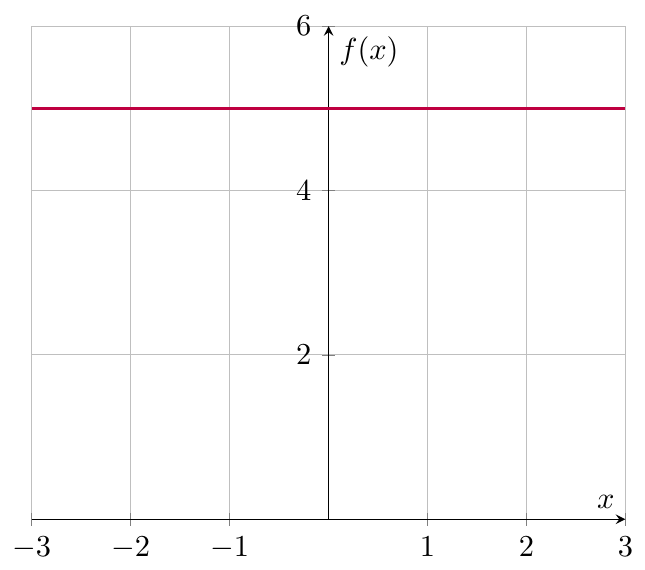
{Constant Function} Consider $f(x) = 5$.
- All inputs map to the same output. - Graph is a horizontal line.
6. Identity Function
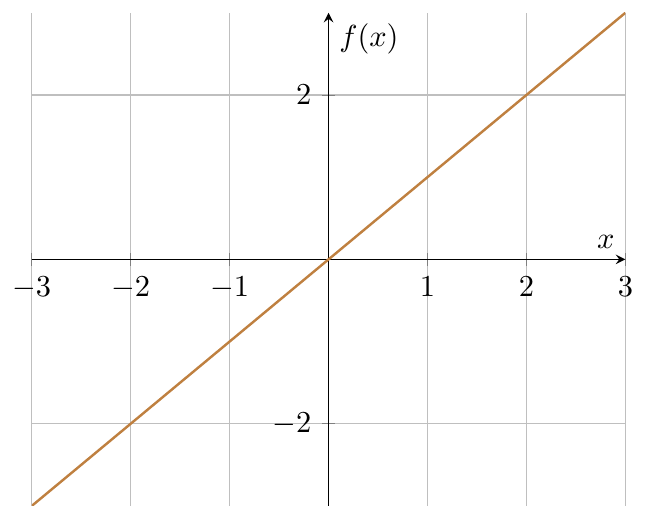
{Identity Function} Consider $f(x) = x$.
- Each input maps to itself. - Graph is a straight line passing through the origin with slope 1.
Inverse Function
An inverse function reverses the operation done by a particular function. Whatever a function does, the inverse function undoes it.
Given a function $f$ with domain $D$ and range $R$, its inverse function (if it exists) is the function $f^{-1}$ with domain $R$ and range $D$ such that \[ f^{-1}(y) = x \quad \text{if and only if} \quad f(x) = y. \] Equivalently, \[ f^{-1}(f(x)) = x \quad \text{for all } x \in D, \quad f(f^{-1}(y)) = y \quad \text{for all } y \in R. \]
Example of an Inverse Function
{Finding an Inverse} Let $f(x) = x^3 + 4$. Solve $y = x^3 + 4$ for $x$: \[ x = \sqrt[3]{y - 4} \] Define $f^{-1}(y) = \sqrt[3]{y - 4}$.
Verification: \[ f^{-1}(f(x)) = \sqrt[3]{(x^3 + 4) - 4} = x \]
One-to-One Functions
A function $f$ is one-to-one if \[ f(x_1) \neq f(x_2) \quad \text{whenever} \quad x_1 \neq x_2 \]
Horizontal Line Test: A function is one-to-one if every horizontal line intersects its graph at most once.
{}
Finding an Inverse Function
Strategy: Solve $y=f(x)$ for $x$, then interchange $x$ and $y$: \[ y = f^{-1}(x) \]
{Finding an Inverse} Find the inverse of $f(x) = 3x - 4$.
Solution: \[ y = 3x - 4 \implies x = \frac{y+4}{3} \implies f^{-1}(x) = \frac{x+4}{3} \]
Domain and Range: Both are $\mathbb{R}$. Verification: \[ f^{-1}(f(x)) = \frac{3x-4+4}{3} = x \]
Graphing Inverse Functions
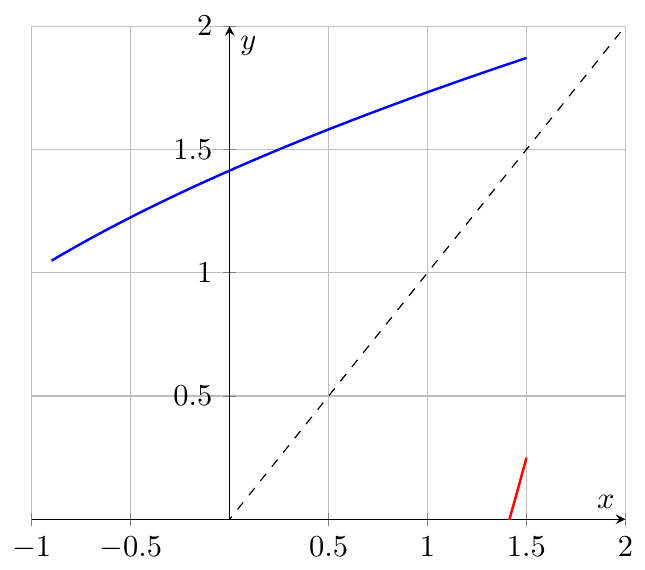
The graph of $f^{-1}$ is the reflection of the graph of $f$ about the line $y=x$.
If $(a,b)$ is on $f$, then $(b,a)$ is on $f^{-1}$.
{Sketching Graph of an Inverse}
Restricting Domains
Some functions are not one-to-one over their entire domain. By restricting the domain, we can define an inverse.
{Restricting Domain of $f(x)=x^2$} \[ g(x) = x^2, \quad x \ge 0 \implies g^{-1}(x) = \sqrt{x}, \quad \text{Domain } [0, \infty) \]
\[ h(x) = x^2, \quad x \le 0 \implies h^{-1}(x) = -\sqrt{x}, \quad \text{Domain } (-\infty, 0] \]
Composite Functions
Given two functions $f$ and $g$, the composite function $f \circ g$ is defined by \[ (f \circ g)(x) = f(g(x)) \] for all $x$ in the domain of $g$ such that $g(x)$ lies in the domain of $f$.
Example of Composite Function
{Composite Function Example} Let $f(x) = x^2$ and $g(x) = x+1$. Then, \[ (f \circ g)(x) = f(g(x)) = f(x+1) = (x+1)^2 \] \[ (g \circ f)(x) = g(f(x)) = g(x^2) = x^2 + 1 \] Notice that in general, $f \circ g \neq g \circ f$.
Rules of Composite Functions
Associative Law: $(f \circ g) \circ h = f \circ (g \circ h)$
Domain Rule: The domain of $f \circ g$ consists of all $x$ in the domain of $g$ such that $g(x)$ is in the domain of $f$.
Non-commutative: In general, $f \circ g \neq g \circ f$.
Example: Associative Law
{Associativity} Let $f(x) = x^2$, $g(x) = x+1$, and $h(x) = 2x$.
Compute $(f \circ g) \circ h$: \[ (f \circ g) \circ h (x) = f(g(h(x))) = f((2x)+1) = (2x+1)^2 \]
Compute $f \circ (g \circ h)$: \[ f \circ (g \circ h)(x) = f(g(h(x))) = f((2x)+1) = (2x+1)^2 \]
Hence, $(f \circ g) \circ h = f \circ (g \circ h)$
Domain of Composite Functions
{Domain Example} Let $f(x) = \sqrt{x}$, $g(x) = x-1$.
Then $(f \circ g)(x) = f(g(x)) = \sqrt{x-1}$.
Domain: $x-1 \ge 0 \implies x \ge 1$, so the domain is $[1, \infty)$
Graphical Representation
{Graph of Composite Function}
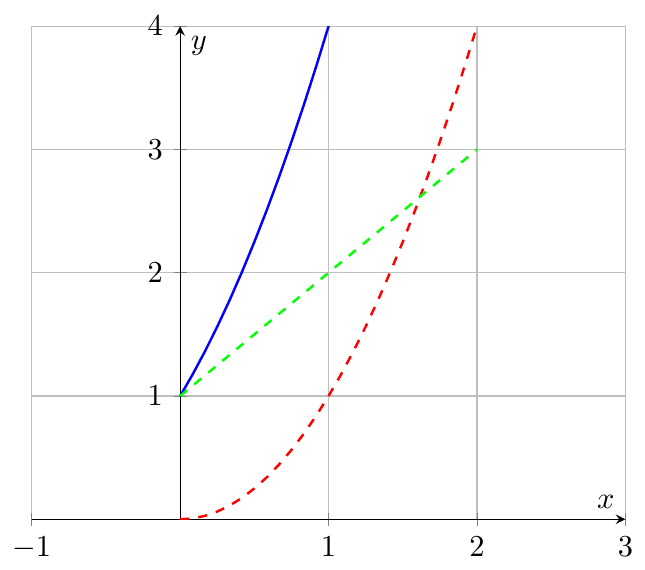
Blue: $(f \circ g)(x) = (x+1)^2$
Green dashed: $g(x) = x+1$
Red dashed: $f(x) = x^2$