Introduction to Statistics
Motivation
Probability starts from the known and predicts data outcomes.
Statistics starts from observed data and infers about the unknown.
Together, they enable evidence-based decisions under uncertainty.
1. Business Forecasting
Goal: Predict future sales.
Method: Use historical data to build a predictive model.
Inference: Make data-driven decisions on inventory and marketing.
2. Legal Evidence
Goal: Determine if a DNA match is reliable.
Method: Use probability to evaluate random match likelihood.
Inference: Decide strength of evidence in court.
3. Quality Control
Goal: Detect faulty products.
Method: Sample and analyze a few items from a batch.
Inference: Accept/reject batch based on probability of defects.
In statistics, we are often interested in studying a large group of individuals or items called the population. However, it's usually impractical or impossible to collect data on every member of the population. Instead, we select a sample — a smaller, manageable subset — and use the information gathered from this sample to make inferences about the entire population.
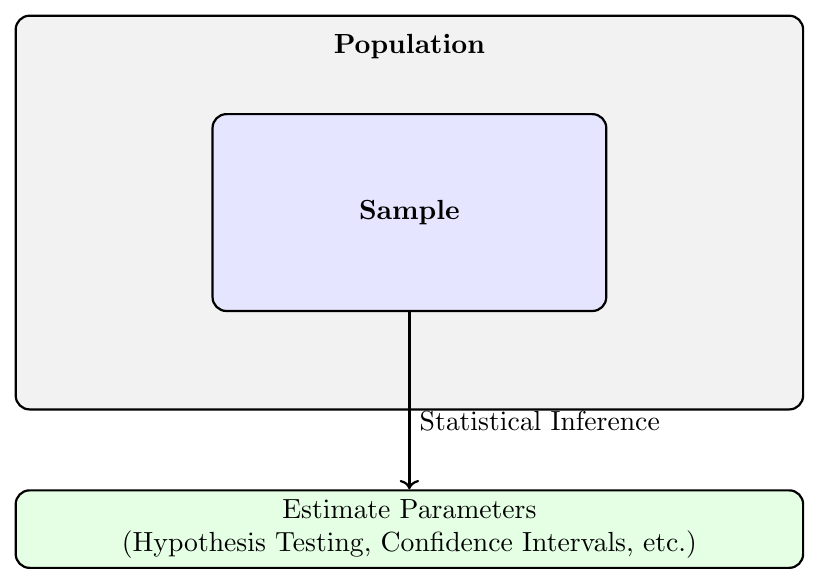
Why Do We Sample?
Cost-effective: It’s cheaper to collect data from a sample than the whole population.
Time-saving: Sampling takes less time than a full population study.
Practicality: Often, the entire population isn’t accessible.
Feasibility: Data analysis becomes manageable.
How Does Inference Work?
Define the population and a variable of interest (e.g., average income).
Select a representative sample from the population.
Collect data from the sample.
Compute statistics (like sample mean, variance).
Use probability theory to estimate population parameters or test hypotheses.
Fundamental Relationship between Probability and Statistics
Probability is used to model uncertainty in the data generation process.
Statistics uses the collected data (from a sample) to estimate the underlying probabilities and infer characteristics of the population.
Real-World Motivation and Example
A pharmaceutical company wants to test the effectiveness of a new drug. Instead of testing on all patients with a disease, they:
Select a random sample of 500 patients.
Administer the drug and collect recovery data.
Use statistical inference to estimate the drug's effectiveness for the entire patient population.
Data Collection
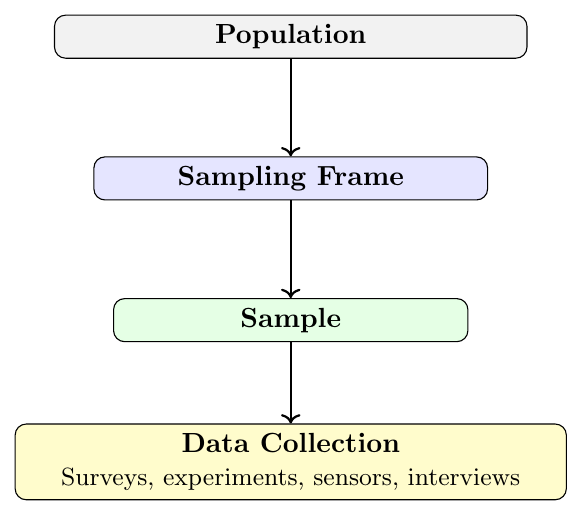
Sampling is the process of selecting a subset (sample) from a larger group (population) to gather insights and make inferences about the entire population. The goal is to collect data efficiently while maintaining accuracy and representativeness.
Steps in the Sampling and Data Collection Process
Define the Target Population
Identify the entire group you are interested in studying (e.g., all college students in India).Specify the Sampling Frame
This is a list or mechanism that gives access to the population (e.g., list of students enrolled in universities).Choose the Sampling Method
Select a technique to draw the sample:Simple Random Sampling: Every individual has an equal chance.
Stratified Sampling: Divide into strata (groups) and sample from each.
Systematic Sampling: Every $k^{th}$ member is selected.
Cluster Sampling: Randomly select entire groups.
Determine the Sample Size
Choose how many observations you need based on budget, precision, and confidence level.Collect the Data
Use surveys, experiments, interviews, observations, or other tools to gather the information.Check for Bias and Errors
Ensure the data is accurate, reliable, and free from systematic errors.
Why is Sampling Important?
Cost-effective: Saves resources by studying a small group.
Time-saving: Quicker than studying the entire population.
Practical: Ideal when the population is infinite or hard to reach.
Accurate: Well-designed samples can produce highly reliable results.
Common Pitfalls in Data Collection
Sampling Bias: Sample is not representative of the population.
Non-response Bias: Some selected participants do not respond.
Measurement Errors: Faulty instruments or survey design can distort results.
Data Entry Errors: Mistakes during manual or automatic input.
Measures of Location
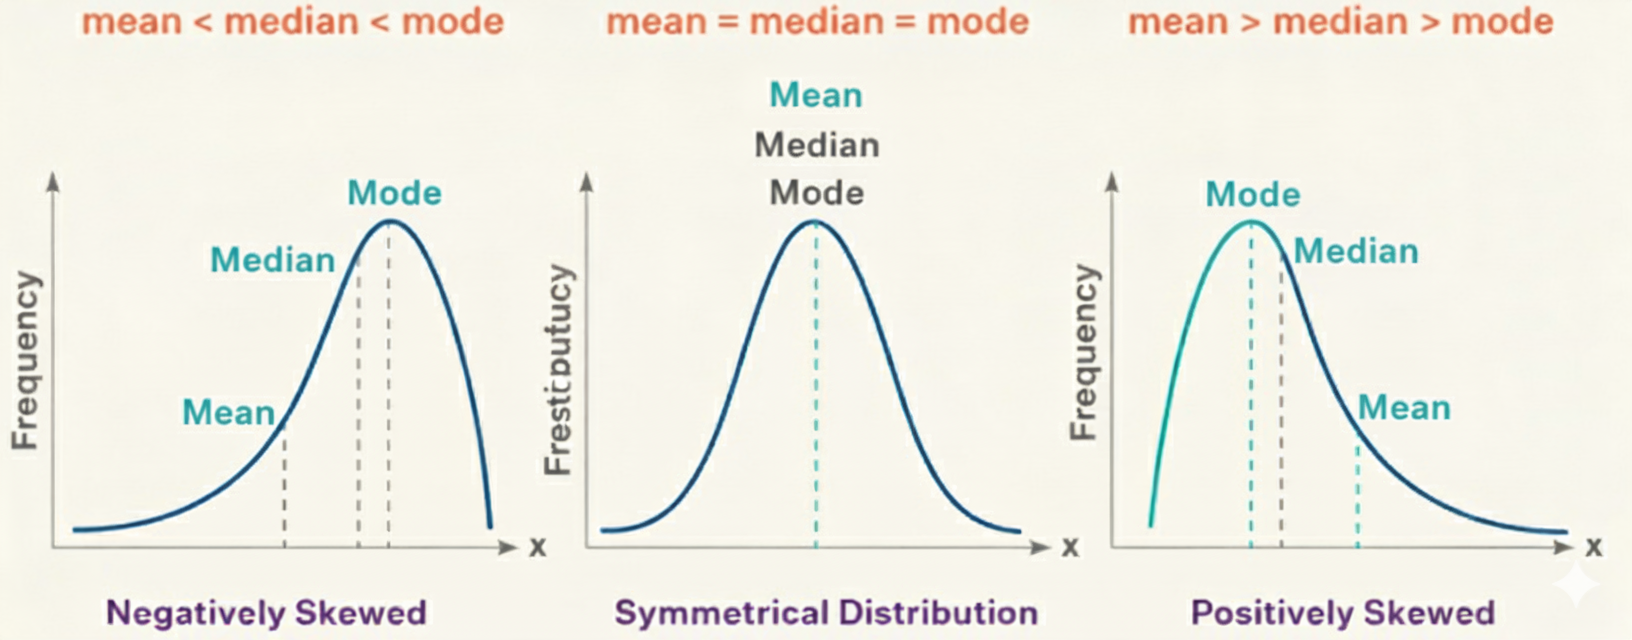
Measures of location describe the central tendency of a dataset. The two most commonly used measures are the sample mean and the sample median. These values summarize the dataset with a single representative value.
Sample Mean ($\bar{x}$)
Suppose that the observations in a sample are \( x_1, x_2, \ldots, x_n \). The sample mean, denoted by \( \bar{x} \), is computed as:
\[ \bar{x} = \frac{1}{n} \sum_{i=1}^{n} x_i = \frac{x_1 + x_2 + \cdots + x_n}{n} \]
\( x_1, x_2, \ldots, x_n \) are the sample observations.
\( n \) is the sample size.
\( \bar{x} \) gives the arithmetic average of the values.
Example:
\[ \text{Let the sample be: } 5,\ 7,\ 9,\ 4,\ 6 \]
\[ \bar{x} = \frac{5 + 7 + 9 + 4 + 6}{5} = \frac{31}{5} = 6.2 \]
The sample mean is sensitive to all data points and is a good measure when data is symmetric and not heavily skewed. It is used in many statistical methods, including confidence intervals and hypothesis testing.
Given a set of $n$ observations in a sample arranged in increasing order of magnitude as: \[ x_1 \leq x_2 \leq \cdots \leq x_n, \] the sample median, denoted by $\tilde{x}$, is defined as: \[ \tilde{x} = \begin{cases} x_{(n+1)/2}, & \text{if } n \text{ is odd} \\ \dfrac{1}{2} \left(x_{n/2} + x_{n/2 + 1} \right), & \text{if } n \text{ is even} \end{cases} \]
Importance:
The sample median provides a measure of the central location of the data.
It is particularly useful when the data contains outliers or is skewed, as it is less affected by extreme values than the mean.
Example:
Consider the following sample of $n=7$ ordered values: \[ 2,\ 4,\ 7,\ 10,\ 12,\ 15,\ 18 \] Since $n = 7$ is odd, the median is the $\left(\dfrac{7+1}{2}\right)^{\text{th}} = 4^{\text{th}}$ observation: \[ \tilde{x} = x_4 = 10 \]
Now consider another sample of $n = 8$ ordered values: \[ 1,\ 3,\ 6,\ 9,\ 11,\ 14,\ 17,\ 19 \] Since $n = 8$ is even, the median is the average of the 4th and 5th observations: \[ \tilde{x} = \dfrac{1}{2}(x_4 + x_5) = \dfrac{1}{2}(9 + 11) = 10 \]
Comparison
The mean considers all values but can be affected by outliers.
The median is less sensitive to outliers and skewed distributions.
In symmetric distributions, mean and median are approximately equal.
NOTE: $\bar{x}$ represents the mean of the sample, whereas $\mu$ represents the mean of the population.
Measures of Variability
Just as there are many measures of central tendency or location, there are many measures of spread or variability. Variability tells you how far apart points lie from each other and from the center of a distribution or a data set. Variability is also referred to as spread, scatter or dispersion. Along with measures of central tendency, measures of variability give you descriptive statistics that summarize your data. While the central tendency, or average, tells you where most of your points lie, variability summarizes how far apart they are. This is important because the amount of variability determines how well you can generalize results from the sample to your population. Low variability is ideal because it means that you can better predict information about the population based on sample data. High variability means that the values are less consistent, so it’s harder to make predictions. Variability is most commonly measured with range, standard deviation and variance .
Definition:
The sample range is the difference between the largest and smallest values in a sample.
\[ \text{Range} = x_{\max} - x_{\min} \]
Why It Is Used:
Gives a quick sense of the spread.
Easy to compute.
Sensitive to outliers.
Example:
Sample: $5,\ 9,\ 12,\ 18,\ 22$
\[
\text{Range} = 22 - 5 = 17
\]
Definition:
Sample variance measures the average squared deviation from the mean. It is denoted by $s^2$ and defined as:
\[ s^2 = \dfrac{1}{n - 1} \sum_{i=1}^{n} (x_i - \bar{x})^2 \]
Where:
$n$ is the number of observations,
$x_i$ is each observation,
$\bar{x}$ is the sample mean.
Why It Is Used:
Reflects the overall spread in the data.
Fundamental in inferential statistics, including hypothesis testing and confidence intervals.
Example:
Sample: $4,\ 6,\ 8,\ 10$
\[
\bar{x} = \frac{4+6+8+10}{4} = 7
\]
Squared deviations:
\[
(4-7)^2 = 9,\quad (6-7)^2 = 1,\quad (8-7)^2 = 1,\quad (10-7)^2 = 9
\]
\[
\sum (x_i - \bar{x})^2 = 9 + 1 + 1 + 9 = 20
\]
\[
s^2 = \frac{20}{4 - 1} = \frac{20}{3} \approx 6.667
\]
Definition:
The sample standard deviation is the square root of the sample variance:
\[ s = \sqrt{s^2} = \sqrt{ \dfrac{1}{n-1} \sum_{i=1}^{n} (x_i - \bar{x})^2 } \]
Why It Is Used:
Represents the typical distance of data points from the mean.
Expressed in the same units as the data.
Widely used in data analysis and reporting.
Continuing the Previous Example: \[ s = \sqrt{6.667} \approx 2.582 \]
Thus, the standard deviation gives a more intuitive sense of variability than variance.
NOTE: $\sigma^2$ represents the population variance, and $\sigma$ represents the population standard deviation.
The formulas for population variance and standard deviation are:
\[ \sigma^2 = \frac{1}{N} \sum_{i=1}^{N} (x_i - \mu)^2 \] \[ \sigma = \sqrt{\sigma^2} = \sqrt{\frac{1}{N} \sum_{i=1}^{N} (x_i - \mu)^2} \]
Explanation:
$x_i$ is each individual data point.
$\mu$ is the population mean.
$N$ is the total number of data points in the population.
$\sigma^2$ is the variance — it measures the average squared deviation from the mean.
$\sigma$ is the standard deviation — it gives a sense of how spread out the data is.
Example: Given a population dataset: 2, 4, 6, 8 \[ \mu = \frac{2 + 4 + 6 + 8}{4} = 5 \] \[ \sigma^2 = \frac{(2-5)^2 + (4-5)^2 + (6-5)^2 + (8-5)^2}{4} = \frac{9 + 1 + 1 + 9}{4} = \frac{20}{4} = 5 \] \[ \sigma = \sqrt{5} \approx 2.236 \]
The sample variance and sample standard deviation both measure how spread out data is, but:
Variance uses squared units (e.g., cm<sup>2</sup>), while
Standard deviation uses linear units (e.g., cm).
Why are both important?
They help understand the variability in data.
Variance is used more in statistical theory.
Standard deviation is more common in real-world applications.
In statistics, we often want to know about a population:
Population Mean $(\mu)$
Population Variance $(\sigma^2)$
Sample variance helps us estimate $\sigma^2$ (population variance), while sample standard deviation is used with the sample mean $\bar{x}$ to estimate $\mu$ (population mean).