Central Limit Theorem and Confidence Intervals
The Central Limit Theorem
Statement: If \( X_1, X_2, ..., X_n \) are independent and identically distributed (i.i.d.) random variables with mean \( \mu \) and standard deviation \( \sigma \), then for large \( n \), the sampling distribution of the sample mean \( \bar{X} \) approximates a normal distribution, regardless of the original distribution.
\[ \bar{X} \sim N\left(\mu, \frac{\sigma}{\sqrt{n}}\right) \]
Z-Score Formula (when population standard deviation is known): \[ Z = \frac{\bar{X} - \mu}{\sigma/\sqrt{n}} \]
T-Score Formula (when population standard deviation is unknown): \[ t = \frac{\bar{X} - \mu}{s/\sqrt{n}}, \quad \text{df} = n - 1 \]
Conditions to Use CLT:
Sample size \( n \geq 30 \) (for non-normal populations).
Random sampling.
Independence of observations.
Tip to Identify: Keywords like "average", "sample mean", "distribution of sample means", "approximate normal", "large sample size" suggest CLT usage.
Examples
The average weight of a mango is 250 grams with a standard deviation of 40 grams. If a sample of 64 mangoes is taken, what is the probability that their average weight is less than 245 grams?
Solution:
Here: \( \mu = 250 \), \( \sigma = 40 \), \( n = 64 \), \( \bar{X} = 245 \)
\[ Z = \frac{245 - 250}{40/\sqrt{64}} = \frac{-5}{5} = -1 \]
Using standard normal table, \( P(Z < -1) = 0.1587 \)
Answer: Probability is approximately \( \boxed{0.1587} \)
The IQ of students has unknown population standard deviation. A sample of 25 students has a mean IQ of 105 with sample standard deviation 10. What is the probability that the true mean is less than 108?
Solution:
Given: \( \bar{X} = 105 \), \( s = 10 \), \( n = 25 \), \( \mu = 108 \)
\[ t = \frac{105 - 108}{10/\sqrt{25}} = \frac{-3}{2} = -1.5, \quad df = 24 \]
Using t-table, \( P(t < -1.5) \approx 0.07 \)
Answer: Probability is approximately \( \boxed{0.07} \)
The average height of a species of plant is 120 cm with \( \sigma = 15 \) cm. What is the probability that a sample of 36 plants has a mean height between 117 cm and 123 cm?
Solution:
\[ Z_1 = \frac{117 - 120}{15/\sqrt{36}} = \frac{-3}{2.5} = -1.2,\quad Z_2 = \frac{123 - 120}{15/\sqrt{36}} = 1.2 \]
Using standard normal table: \[ P(-1.2 < Z < 1.2) = 2 \times P(Z < 1.2) - 1 = 2 \times 0.8849 - 1 = 0.7698 \]
Answer: Probability is approximately \( \boxed{0.7698} \)
A machine produces screws with a mean weight of 5g and standard deviation 0.2g. What is the probability that a sample of 100 screws has a mean weight greater than 5.03g?
Solution: \[ Z = \frac{5.03 - 5}{0.2/\sqrt{100}} = \frac{0.03}{0.02} = 1.5 \] \[ P(Z > 1.5) = 1 - 0.9332 = 0.0668 \]
Answer: Probability is approximately \( \boxed{0.0668} \)
Exam scores are normally distributed with mean 70 and \( \sigma = 10 \). What's the probability that a sample of 49 students scores above 72 on average?
Solution: \[ Z = \frac{72 - 70}{10/\sqrt{49}} = \frac{2}{1.43} \approx 1.4 \] \[ P(Z > 1.4) = 1 - 0.9192 = 0.0808 \]
Answer: Probability is approximately \( \boxed{0.0808} \)
Confidence Intervals
A Confidence Interval (CI) is a range of values, derived from sample statistics, that is likely to contain the value of an unknown population parameter. It is associated with a confidence level, which quantifies the level of confidence that the parameter lies within the interval.
For example, a 95% confidence interval for the population mean suggests that if we were to take 100 different samples and compute a CI for each, approximately 95 of those intervals would contain the true population mean.
Alpha ($\alpha$) represents the probability of rejecting the true parameter. It is given by: \[ \alpha = 1 - \text{Confidence Level} \] For example, if the confidence level is 95%, then $\alpha = 0.05$.
In a two-tailed test, $\alpha/2$ is the area in each tail.
The degrees of freedom (df) refer to the number of values in the final calculation of a statistic that are free to vary. For estimating the population mean using sample variance, the degrees of freedom are: \[ df = n - 1 \] where $n$ is the sample size.
Formula: \[ CI = \bar{x} \pm z_{\alpha/2} \cdot \frac{\sigma}{\sqrt{n}} \]
$\bar{x}$ = sample mean
$\sigma$ = population standard deviation
$n$ = sample size
$z_{\alpha/2}$ = critical value from standard normal distribution
Formula: \[ CI = \bar{x} \pm t_{\alpha/2, df} \cdot \frac{s}{\sqrt{n}} \]
$s$ = sample standard deviation
$t_{\alpha/2, df}$ = critical value from t-distribution with $df = n - 1$
Formula: \[ \left( \frac{(n-1)s^2}{\chi^2_{\alpha/2}}, \frac{(n-1)s^2}{\chi^2_{1 - \alpha/2}} \right) \]
$\chi^2$ = critical value from chi-square distribution
$s^2$ = sample variance
$n$ = sample size
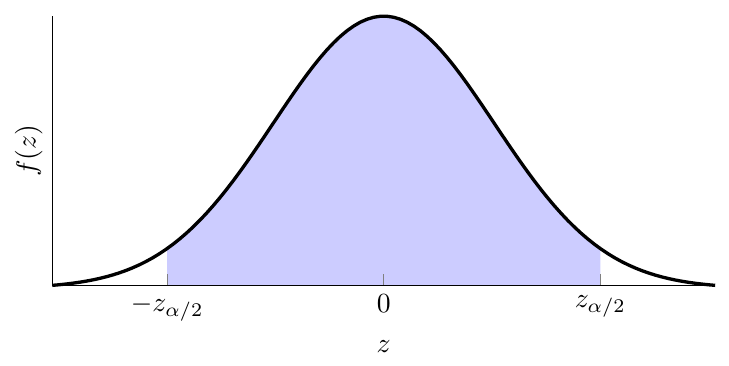
The shaded area represents the 95% confidence region. The tails (unshaded) represent $\alpha/2 = 0.025$ each.
The average weight of a mango is 250 grams with a standard deviation of 40 grams. If a sample of 64 mangoes is taken, what is the probability that their average weight is less than 245 grams?
Solution:
Here: \( \mu = 250 \), \( \sigma = 40 \), \( n = 64 \), \( \bar{X} = 245 \)
\[ Z = \frac{245 - 250}{40/\sqrt{64}} = \frac{-5}{5} = -1 \]
Using standard normal table, \( P(Z < -1) = 0.1587 \)
Answer: Probability is approximately \( \boxed{0.1587} \)
The IQ of students has unknown population standard deviation. A sample of 25 students has a mean IQ of 105 with sample standard deviation 10. What is the probability that the true mean is less than 108?
Solution:
Given: \( \bar{X} = 105 \), \( s = 10 \), \( n = 25 \), \( \mu = 108 \)
\[ t = \frac{105 - 108}{10/\sqrt{25}} = \frac{-3}{2} = -1.5, \quad df = 24 \]
Using t-table, \( P(t < -1.5) \approx 0.07 \)
Answer: Probability is approximately \( \boxed{0.07} \)
The average height of a species of plant is 120 cm with \( \sigma = 15 \) cm. What is the probability that a sample of 36 plants has a mean height between 117 cm and 123 cm?
Solution:
\[ Z_1 = \frac{117 - 120}{15/\sqrt{36}} = \frac{-3}{2.5} = -1.2, \quad Z_2 = \frac{123 - 120}{15/\sqrt{36}} = 1.2 \]
Using standard normal table: \[ P(-1.2 < Z < 1.2) = 2 \times P(Z < 1.2) - 1 = 2 \times 0.8849 - 1 = 0.7698 \]
Answer: Probability is approximately \( \boxed{0.7698} \)
A machine produces screws with a mean weight of 5g and standard deviation 0.2g. What is the probability that a sample of 100 screws has a mean weight greater than 5.03g?
Solution: \[ Z = \frac{5.03 - 5}{0.2/\sqrt{100}} = \frac{0.03}{0.02} = 1.5 \] \[ P(Z > 1.5) = 1 - 0.9332 = 0.0668 \]
Answer: Probability is approximately \( \boxed{0.0668} \)
Exam scores are normally distributed with mean 70 and \( \sigma = 10 \). What’s the probability that a sample of 49 students scores above 72 on average?
Solution: \[ Z = \frac{72 - 70}{10/\sqrt{49}} = \frac{2}{1.43} \approx 1.4 \] \[ P(Z > 1.4) = 1 - 0.9192 = 0.0808 \]
Answer: Probability is approximately \( \boxed{0.0808} \)